Thursday, June 30, 2016

Recovery??

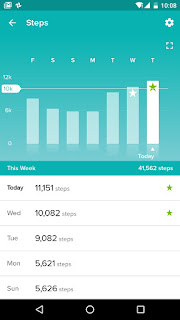
My Fitbit vibrated the other night. I looked and it said 10003. I didn't even know it did that. On good days, I only can manage about 6000 without getting sick. And I usually manage that about 3 times a week. On those days, I can't do anything else. This time, however, I was sitting up blogging, after scrubbing the bathtub and taking shower.  Then I threw in 2x6 pushups for  a good measure. That's several times more than I should be able to, and yet I didn't get sick. I'm not sleeping well either despite the increased activities. So I went out and walked 2 miles today to improve my  sleep.


What's going on here? I am tracing back what changed recently.  Only thing I can think of is switching a month ago to brown rice as my staple to lower my triglyceride. That fixed my constipation as well. My poop is now light brown with no trace of white streaks that the dark stool used to sport. Could this have changed my CFS? Probably not. Chances are that it was just the time for me to recover, if it is indeed a recovery.

Interestingly, there was a report recently that CFS patients have greatly reduced gut microbiome and that may serve as a diagnostic biomarker. Though they weren't really claiming that the biome change was the cause of CFS, the insinuation was that the reduction of the anti-inflammatory gut bacteria could be the cause of CFS. If I indeed recovered because of the change in my diet, that would lend a credibility to such claim. But chances are I didn't. If CFS is as simple as the change in gut bacteria, someone would have found it out long time ago and we would've had a solution by now. Many CFS patients have already tried diet change to improve their conditions. And the gut microbiome does not begin to explain the constellation of neurological symptoms that CFS patients experience, ranging from brain fog to sound/light sensitivity and even paranoia in some cases.

I'm planning to walk 3 miles this weekend. On Monday, I'll find out if the recovery is real. If it is, it would be so anticlimactic that, after wallowing in sickness for so long, 2 weeks shy of 8 years to be exact, it suddenly dissipated like a fog burning off in the afternoon. It would be so unreal.

Tuesday, June 28, 2016

Intensity and Blood Pressure

The other day, I walked a block at a normal speed on a slight incline as if I were healthy. Soon after,  light-headedness and subdued feeling came over. I checked my blood pressure and the top number was 15 points below normal while the bottom one was off by 5. It lasted for several hours before my blood pressure returned to normal. This is a common occurrence for me with intense activities in a short spurt.

Monday, June 27, 2016

Measuring Exertion

What exactly is it in exertion that triggers the flu-like sickness in CFS patients? In real life, we normally associate exertion with muscular force, but muscular exertion usually does not cause sickness in healthy people. So we don't know what exertion really means in the context of CFS physiology; exertion is as problematic as fatigue to define and measure.

In the paper Evidence for sensitized fatigue pathways..., Staud et. al. had CFS patients perform grip exercise with and without the cuff. Healthy controls did not feel any difference. CFS patients, on the other hand, felt fatigue when their arms were cuffed. They surmised from this that CFS patients were more sensitive to metabolites. This suggests the possibility of exertion being the effort against the metabolite load in CFS patients. Though the fatigue from the metabolite accumulation is immediate (or with some delay till the metabolites get into the bloodstream from the muscles), the higher effort required to work through the amplified perception of the metabolite load could be causing the flu-like sickness the next day.

The metabolites in blood stream dissipates exponentially as they get filtered out by the body. The metabolite concentration at time t, or the residual, is express with the equation of:

C(t) = C0*e-kt

With ongoing exercise, the total build-up will be then the sum of all Ci(t) from t = 0 to t:

Q(t) = ∫C(t)*e-ktdt

This can be approximated with summation of all residuals of C.

Q(t) = C0*e-kt + C1*c-k(t-1)...

It would be reasonable to assume that the metabolites produced are proportional to the calories spent, since the metabolites are by-products of burning fuel. We can also assume that there is no metabolite accumulation in the resting state. Then we could use activity calories as the proxy for the metabolite concentration at time t. And the cumulative concentration of metabolites at time t can be computed in R as:

q = Reduce(
    function(a,b) a*(1-k) + ifelse(b-C<0,0,b-C), 
    as.vector(fintraday$calories), 
    0, 
    accumulate=T,
)

fintraday$calories is a time series of calories spent at each minute of the day and q is the accumulation of exponentially aged calories standing in as the metabolite load at each given minute. The plot for calories spent vs. metabolite load looks like this:


To maintain the same walking speed against this load, the body has to work harder by increasing the "effort". And when this effort going above certain threshold could be causing the sickness. So, we can take the highest metabolite load and use that as the proxy of the effort.

Note that the metabolite load will dissipate rather quickly if you take the rest, substantially lessening the effort required to move after the rest. And this could be why CFS patients like Bruce Campbell reported being able to go much further when they incorporated rests in their walk. This is also confirmed by my own experience. Reducing the speed by 5-10%  also allows you to go about twice as further without triggering the post-exertional sickness. Conversely, increasing the speed by 5-10% will half the distance you can walk without triggering the post-exertional sickness.

Walking faster means not only building up the load exponentially faster, but also working harder against the load. A double whammy, if you will. Increasing the speed just by a couple more steps per minute when walking 1km triggers the sickness for me the next day, and this is probably why.

There is also the cumulative effect of exertion. As I noted before, the same exertion that normally does not trigger the post-exertional sickness can when I am weakened by activities of previous days. So, I summed up the metabolite stress over N days, with the metabolite stress being max(q), to see if that more accurately predicts the fatigue rating. It turned out that 4 day sum (d4) yields the best correlation. Here is the graph from Aug. 2015:


The cumulative effect of exertion may not be time-invariant. For the past 9 months, the d4's correlation to fatigue has been steadily decreasing over months while the maxq's correlation has been steadily increasing.  It's as if the cumulative effect of exertion has been diminishing and the fatigue has become more heavily influenced by the exertion the day before.

Still, d4 and maxq predicts the fatigue substantially better than raw calories or steps taken. So I might be onto something here. To be continued..

Wednesday, June 22, 2016

Why Blog?

Stayed in bed for 10 hours and yet I felt all spent when I got up this morning. That's probably because I stayed upright more than usual blogging, taking care of bills and otherwise getting some work done yesterday. On a normal day, I only can work less than 2 hours. Yesterday, it was total of 5 hours, spread throughout the day. Why, if I could work for 5 hours everyday, I could return to the society as a productive member!

So, the question is, why spend precious time on blogging when I only have a couple of hours a day available to me? I could more productively spend it doing actual work. The problem is, I work alone. This should sound familiar to CFS patients. We tend to lose connections after spending years home-bound. And it's more difficult to make a progress when you work on a project alone. You need the sounding board of colleagues. Blogging serves that purpose of the sounding board. To blog, you have to articulate. While articulating ideas come to you. And that's invaluable, even if you don't get feedback from anybody.

I'm out of coffee and pasta. But I don't feel like an errand today. I'll make do with what I have and postpone the trip till tomorrow.

Tuesday, June 21, 2016

Measuring Resting Time

So, I concluded that time spent lying down is the best fatigue/performance measure. The question now is how to measure the time spent lying down.

Polar activity trackers track the time spent resting. (See the supine icon with "1hr 25" below it in the picture below? That is the time spent resting). I'm not sure if that is same as time spent lying down or if it can serve as the fatigue/performance metric. But it will be worthwhile exploring. I'll eventually buy one and check it out. For now, I'm staying with Fitbit Charge HR that I already spent money on last year. (I made a feature request to Fitbit to add resting in activities they track, but I haven't heard from them pip squeak).


One way to detect when you are lying down is by monitoring the heart rate. It goes  up about 5 bps when you sit up and another 5 bps when you stand up. But the heart rate is so variable that I don't think it is possible to figure out when you are lying down just by looking at the heart rate. The noise is bigger than the signal, in other words, as you can see in the plot below. And you can't extract useful information when the noise is bigger than the signal unless you can tag the noise somehow and eliminate it, at least partially.


So instead I looked at both the heart rate and calorie data to see if their being at certain level correlates to time spent lying down or fatigue level.  And it turned out that the total number of minutes with less than 120% of the base calories correlates to the fatigue rating at 68%. (Again, this was done for the period from 7/19 to 8/11, for which the manually logged resting time is available).

getCalMinutes=function(fintraday)
{
  wakingcals=fintraday[(10*60+1):(22*60),]$calories
  restingcal=min(wakingcals,na.rm=T)
  sapply(1:20,function(i)length(which(wakingcals<(restingcal*(1+i/20)))))
}

calMinutes=by(fintradays,as.Date(index(fintradays),tz="US/Pacific"),getCalMinutes,simplify=T)
# by() returns a list. convert it to a matrix
calMinutes=t(simplify2array(calMinutes))
# it is now matrix of minutes of N percentile calories for each day. convert it to zoo
dates=rownames(calMinutes)
calMinutes=as.zoo(calMinutes,as.Date(dates))
# Compute correlation to resting minutes and fatigue
calMinutes=merge(calMinutes,restingMinutes,fatigue=lag(daily$fatigue,-1),all=F)
cor(calMinutes,cbind(restingMinutes=calMinutes$restingMinutes,fatigue=calMinutes$fatigue))

               restingMinutes    fatigue
calMinutes.1        0.4571173 -0.5230321
calMinutes.2        0.3673384 -0.4677888
calMinutes.3        0.5258373 -0.6054458
calMinutes.4        0.5494959 -0.6842468
calMinutes.5        0.5929351 -0.6026978
...

68% is a strong correlation and may serve as the proxy for fatigue/performance measure. Unfortunately, it dropped to 43% when I ran it for the complete time period of 1 year. So, it is not that usable.

For strong correlation, I may have to return to the heart rate again. If I combine with motion data, I may be able to tell if I'm resting. That is how the trackers tell if you are sleeping. The problem is there is no tracker that makes the accelerometer/gyroscope data available. They only give you processed data like calories and activity times. So, for that, I may have to resort to an Android Wear device that will let me access all raw data through Android API.

I'll need the raw data anyway to discern activities like showering, doing dishes or doing a few push-ups. (Commercial activity trackers don't need to track those mundane activities since their aim is to make healthy people healthier. But CFS patients need to track ADLs because mundane ADLs are equivalent to heavy exercises for them.) So I may skip Polar tracker and go straight to an Android Wear watch.

Monday, June 20, 2016

Summer Begins in SF


Still under the weather from the errand run on 6/17. But I trekked 800m to a coffee shop as planned, and yes, it was a bit of struggle.  I just had to get out of the house after being cooped up for 2 days. Besides, it was a beautiful day, the first day of Summer, no less. (And, yeah, don't believe that bit about Summer in SF being the coldest Winter. Not too much anyway).


Sunday, June 19, 2016

How to Log Activities

You probably wondered about my activity log format. Here is what the headings look like.

DateActivitiesactivity levelSleeppredicted fatiguemorning fatiguefatigueevening fatigue
Note
1/1/2016Van Ness Philz (300m), Larkin/Turk (1.2km), 5+5 pushups57
5.14.9

I use Google Sheet. It is free, and, more importantly, you can access from your smartphone. Being able to work on your smartphone while lying down is a must if you are spending half of your waking hours lying on couch or bed like I do. Having to get up, fire up the laptop just to log is a drag, trust me, especially when you are sick.

Logging the daily activities requires only one line on the spreadsheet. And it doesn't take more than a minute. You don't need to recount your whole day; you only need to log top 4 or 5 activities that matters. And that's fine since you are not going to engage in a slew of activities anyway if you are a CFS patient.

Activity level is a subjective rating of the intensity/amount for the day as whole. The scale of 1-5 should be good enough though I use 1-6. (My rating system has evolved rather than designed. The maxim of "do as I day, not as I do" applies here). To determine the rating, imagine the most you can do and rate that as 5. And doing the least gets the rating of 1.  The middle is 3 and somewhere in betweens get 2 or 4.

I also use an activity tracker to track my activities, and the tracker data is what I use in my analysis, not the Activity Level field from my log. If you don't have an activity tracker, you may want to use finer scale of 1-9 for the Activity Level. It's a bit more difficult to judge in finer level, but that may aid you better in the analysis.

One note on activity tracking: taking shower takes quite a bit out of you. I used to take my activity tracker off when taking shower. Then I noticed that my numbers didn't quite match up with the log. I evetually realized that the showers were the culprit. I've been wearing my tracker while taking shower ever since then. So you will want a water resistant/proof tracker if you want to get one.

The sleep is also a subjective rating of how well I slept rather than how long I stayed in bed. So far, I haven't found  a good use for this variable. The correlation between sleep and fatigue has been minimal -- it's been all about activities in my case.  And the sleep depends on the activities, making it another response variable rather than a controlling one.

Predicted Fatigue is the fatigue that I predict for the next day. The whole point of logging is to learn the relationship between activities and resulting fatigue. And being able to predict is the only proof that you truly understand the relationship. You could explain after the fact, but that's not going to get you anywhere. You have to be able to predict.  I come up with prediction by looking at the activity level of preceding days.

Fatigue field is the actual fatigue of the following day. (In my example above, it would be the fatigue on 1/2, not 1/1). This can be a bit confusing, but there is a good reason to log this way. When analyzing the data, it's much simpler to have the activities and the resulting fatigue on the same line rather than having to look at the next line to figure out the fatigue caused by the activity on a given day.

My fatigue rating scale also evolved and probably not the best example to use. So you can pretty much ignore the value in my examples. Instead, I recommend the scale of 1 to 5 for the fatigue rating, with 1 being your worst day and 5 being your best day. 3 is the middle one and it is important to clearly establish what 3 means. For me, it is being able to take care of all ADL (activities of daily living) with the most struggle. If I start giving up, it's less than 3. If I struggle less and be able to do more than just ADL, it is above 3.

Alternatively, you can use a finer scale of 1-9. This is actually what I do in reality. In this scale, 5 would be the middle (representing being able to take care of all ADL with lots of struggle, in my case).

I used to log the fatigue for the whole day. Then I noticed that fatigue can vary within a day, sometimes substantially. So I divided it into morning (8AM-1PM), afternoon (1PM-6PM) and evening (6PM-11PM) . I'm still long way off from being able to predict fatigue on hourly basis, so this has not been terribly useful for me. You could just long one fatigue for the whole day.

The resulting simplified log, with the fatigue scale of 1-9, would look like this:

DateActivitiesActivity LevelSleepPredicted FatigueFatigueExplanation
1/1/2016Van Ness Philz (300m), Larkin/Turk (1.2km), 5+5 pushups4754